U.S. WINTER MUCH WARMER THAN AVERAGE;
DROUGHT WORSENED IN SOUTHWEST, SOUTHERN PLAINS; NORTHWEST HAD HEAVY RAINSMarch 9, 2006 — The 2005-2006 Winter season was the fifth warmest December-February period on record for the contiguous United States, according to scientists at the NOAA National Climatic Data Center in Asheville, N.C. During the same time, drought conditions worsened in the Southwest and southern Plains, while the Northwest endured heavier-than-average precipitation. (Click NOAA image for larger view of winter 2005-2006 statewide temperature rankings. Please credit “NOAA.”)
U.S. Temperatures
Based on preliminary data, the average temperature for the contiguous United States for December-February was 36.3 degrees F (2.4 C). This was 1.2 degrees F (0.7 C) above the 1895-2005 mean, making it the fifth warmest winter on record. A record warm January dominated the winter average, with December and February near average nationally. The mean 2005-2006 winter temperature in 41 states was above- or much above average, with only seven states near average and none cooler than the long-term mean. The relatively warm winter led to below normal residential energy demand for the U.S., as measured by the nation's Residential Energy Demand Temperature Index. Using this index, NOAA scientists determined that the nation's residential energy demand was approximately 11 percent less than what would have occurred under average climate conditions for the season.
U.S. Rainfall
Overall, winter precipitation was near average for the nation, however, extremely dry conditions prevailed throughout much of the Southwest and central and southern Plains. Much of the Far West and Northwest was much wetter than average for December-February. For Arizona, this was the driest winter on record and second driest on record for New Mexico and Oklahoma. Five other states (Texas, Missouri, Arkansas, Kansas and Nebraska) were much drier than average. At the end of winter, moderate-to-extreme drought (as defined by a widely-used measure of drought—the Palmer Drought Index) affected about 25 percent of the contiguous U.S. This is the largest combined area of drought in the nation since July 2004. (Click NOAA image for larger view of winter 2005-2006 statewide precipitation rankings. Please credit “NOAA.”)
Exceptional drought was focused in an area from southern Texas through eastern Oklahoma, western Arkansas to southwest Missouri. As of March 6, Phoenix had reached 140 days without measurable rainfall, a string that eclipsed the previous record of 101 days, which occurred Sept. 23, 1999, through Jan. 1, 2000. Additionally, Tulsa, Okla., had its driest winter since records began in 1888, with just 1.59 inches of precipitation during the three-month period.
The dryness exacerbated wildfire activity that burned more than 500,000 acres across the country since January and approximately one million acres since the first of November, according to preliminary data from the National Interagency Fire Center in Boise, Idaho. The vast majority of wildfire activity has been in the southern Plains, particularly Oklahoma and northeast Texas, where lack of precipitation and much warmer-than-average temperatures have prevailed this winter. By contrast, a series of powerful Pacific storms hit the Northwest and parts of the West during December and January and four western states (Washington, Oregon, Idaho, and Nevada) were much wetter than average for the season.
U.S. Snow
Snowpack across the West reflected the general distribution of precipitation with parts of the Northwest at more than 150 percent of normal, while much of the Southwest had far less than 50 percent of normal winter snowpack at the end of February. Both Arizona and New Mexico have seen a nearly unprecedented lack of snowfall this season. In Flagstaff, Ariz., as of Feb. 28, only 1.6 inches of snow had fallen since autumn began. This contrasts with a normal snow total of 72.5 inches for the period.
Several significant snow storms impacted the nation during the winter, including a powerful storm that hit the East Coast on Feb. 11-12. Areas of New Jersey, New York and Connecticut received more than 20 inches of snow during the event, which was classified as a Category 3 ("major") snow storm by the new Northeast Snowfall Impact Scale.
Also during the winter, Tropical Storm Zeta developed near the end of December becoming the 27th named storm during the record-setting 2005 Atlantic hurricane season. It weakened below tropical storm strength during the first week of January without making landfall.
NOAA, an agency of the U.S. Department of Commerce, is dedicated to enhancing economic security and national safety through the prediction and research of weather and climate-related events and providing environmental stewardship of the nation's coastal and marine resources.
Through the emerging Global Earth Observation System of Systems (GEOSS), NOAA is working with its federal partners and nearly 60 countries to develop a global monitoring network that is as integrated as the planet it observes.
Relevant Web Sites
NOAA U.S. National Overview: February and Winter 2006
NOAA National Climatic Data Center
NOAA Drought Information Center
Media Contact:
John Leslie, NOAA Satellites and Information Service, (301) 457-5005
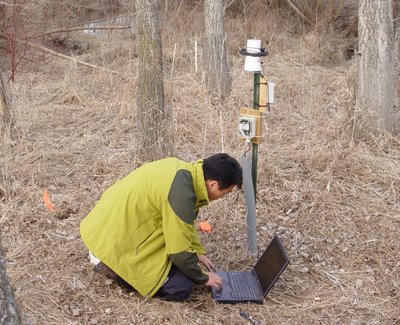
 Fig. 1 Pumping groundwater and flowing it into a bottle continuously (Step 1)
 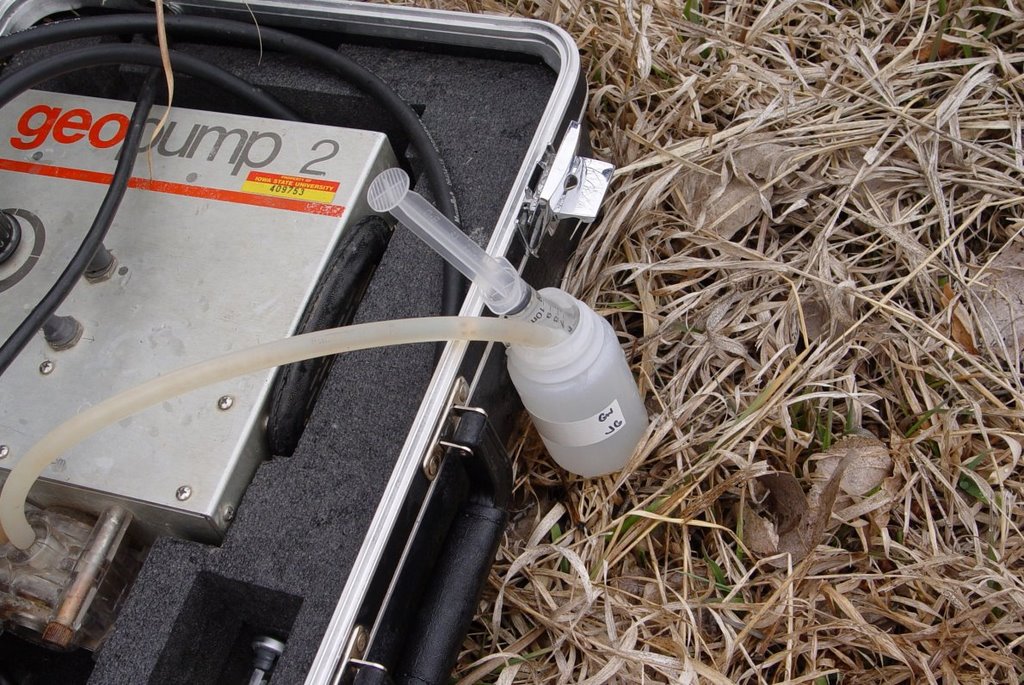 Fig.2 Collecting grounwatet in a bottle with a 10ml sylindge (Step 2).
 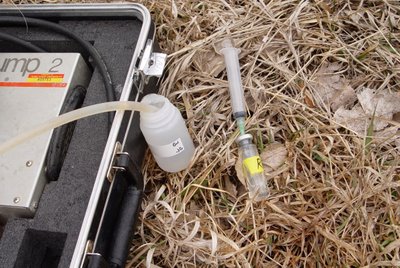 Fig. 3 Injecting the water into a 20ml He evacuated glass vial (Step 3).
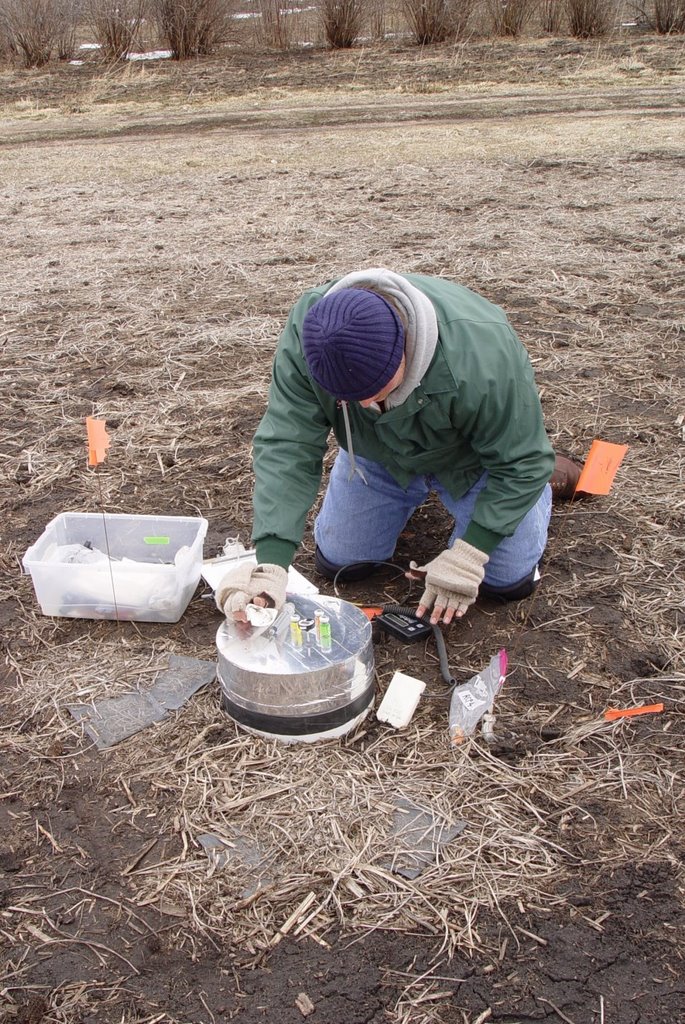
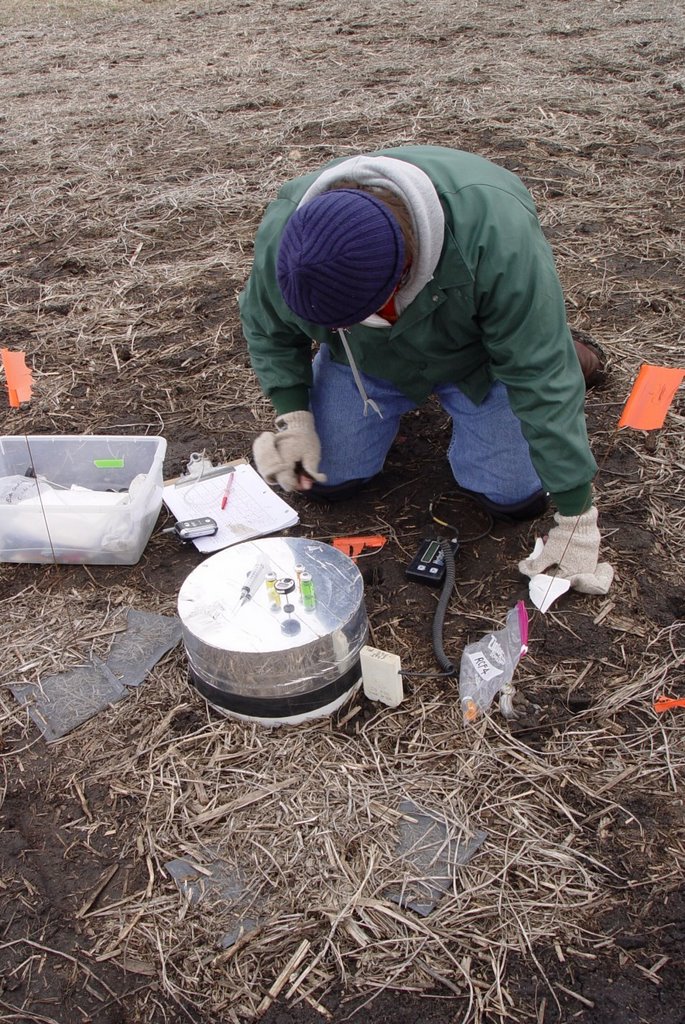

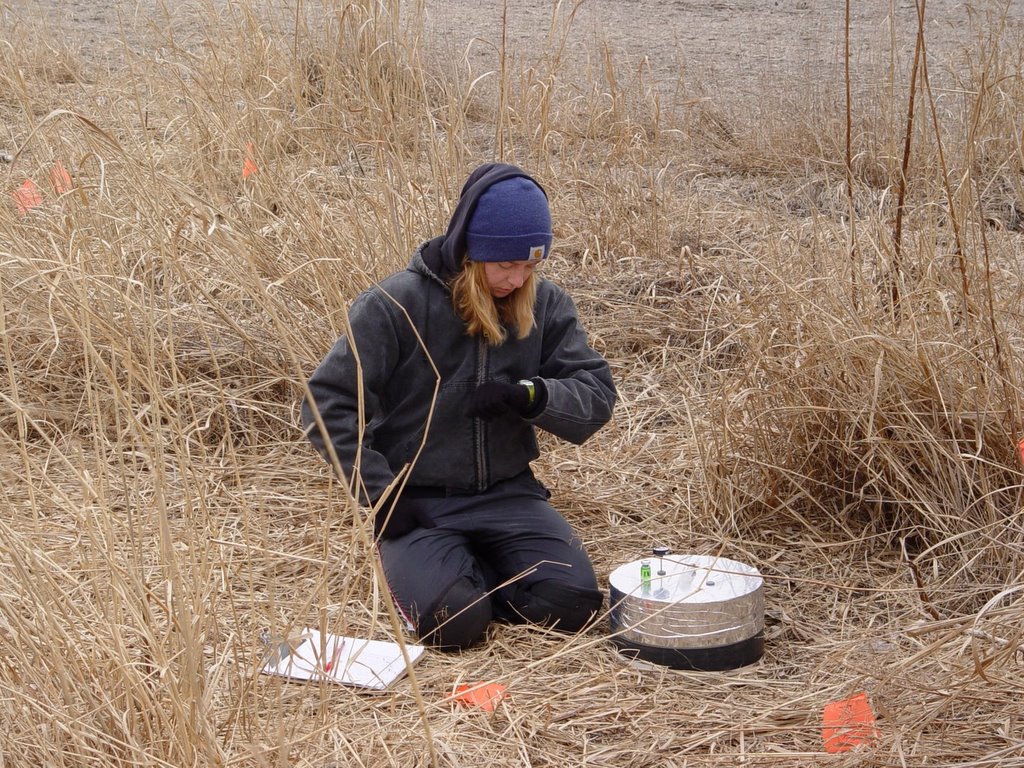
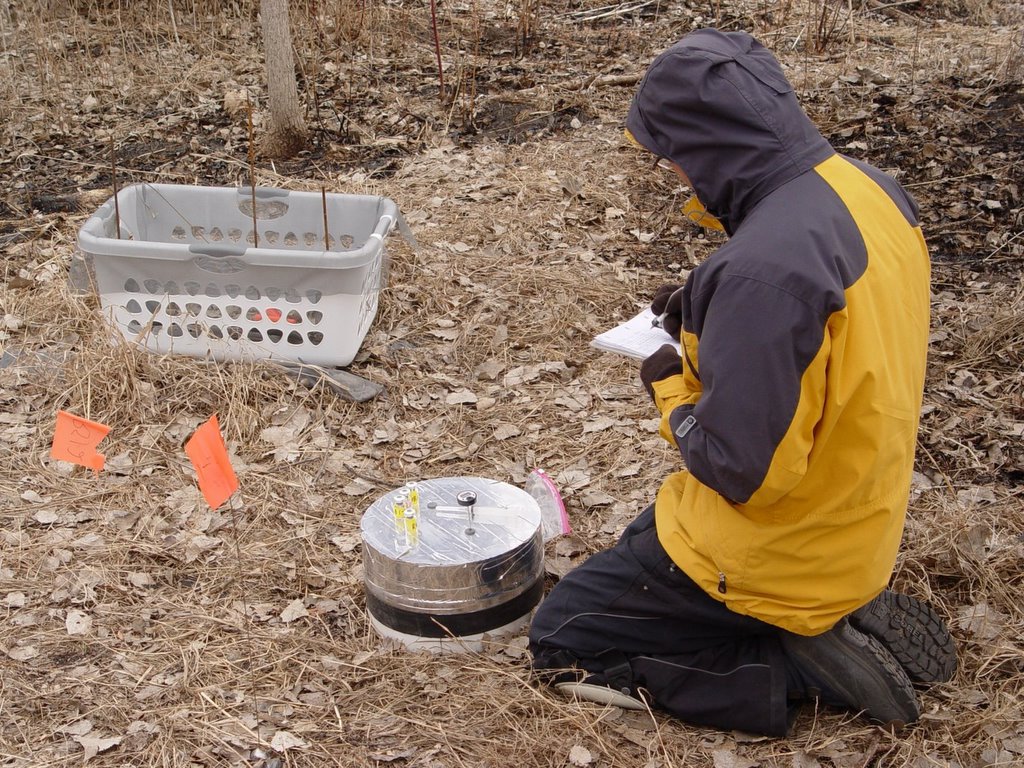
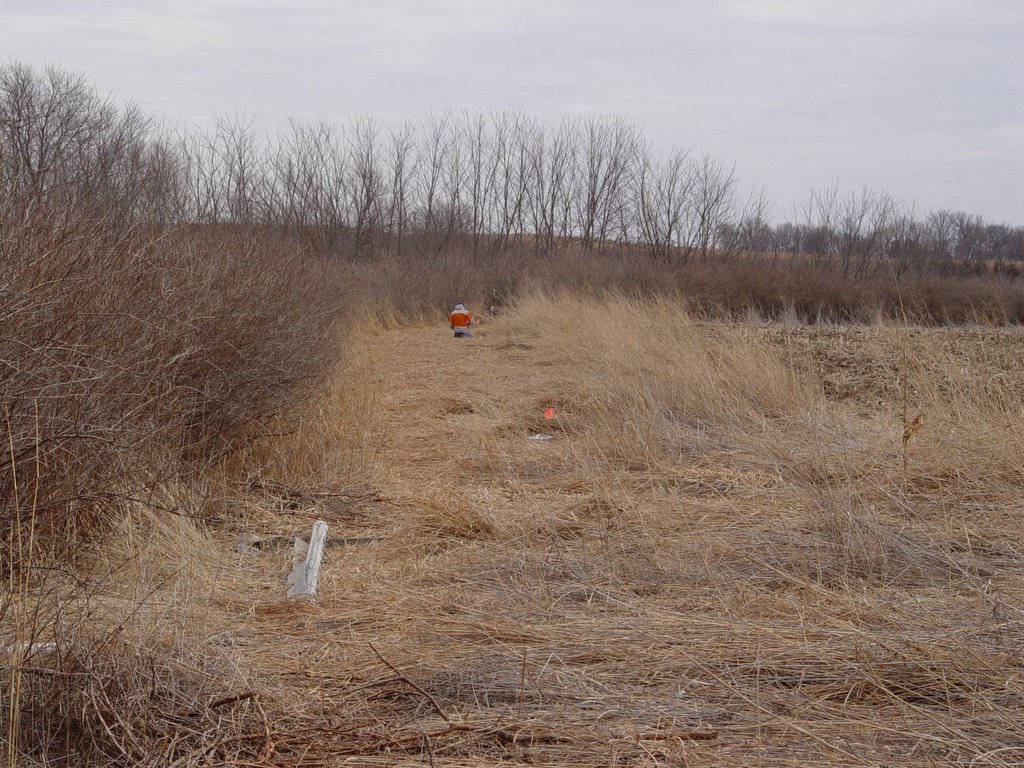
 Fig. 2 Mustafa is collecting gas samples from a gas chamber in the RCF.
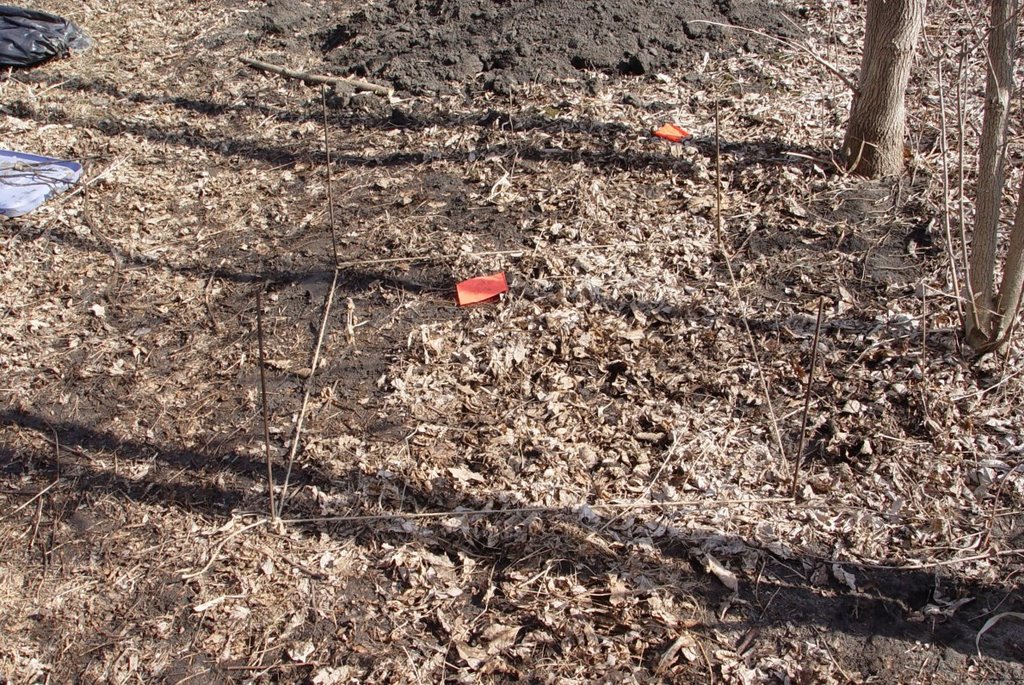
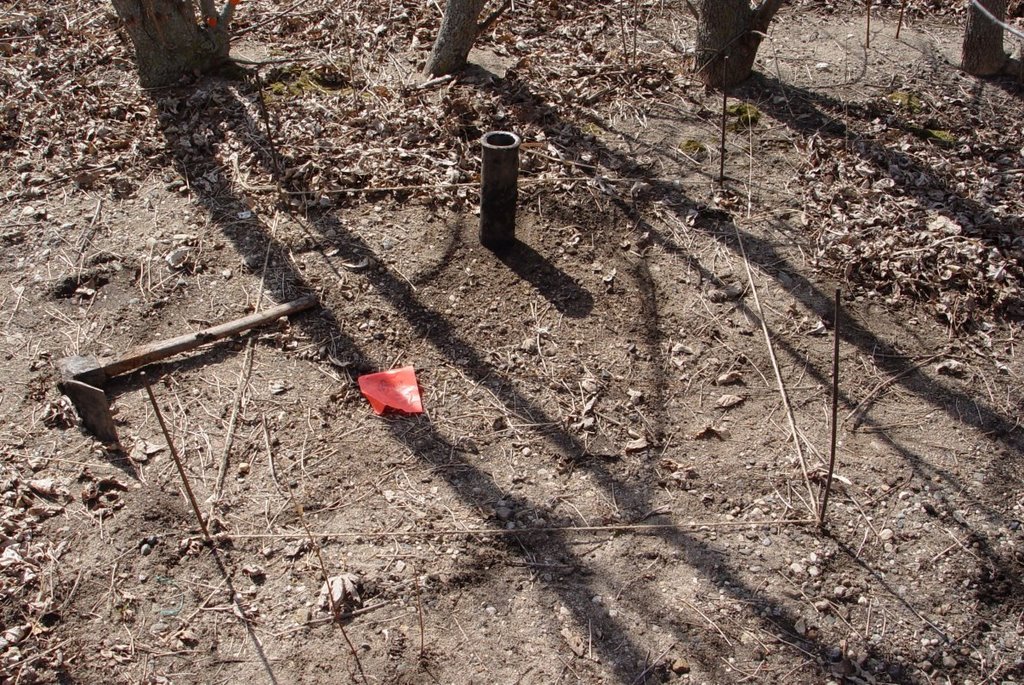
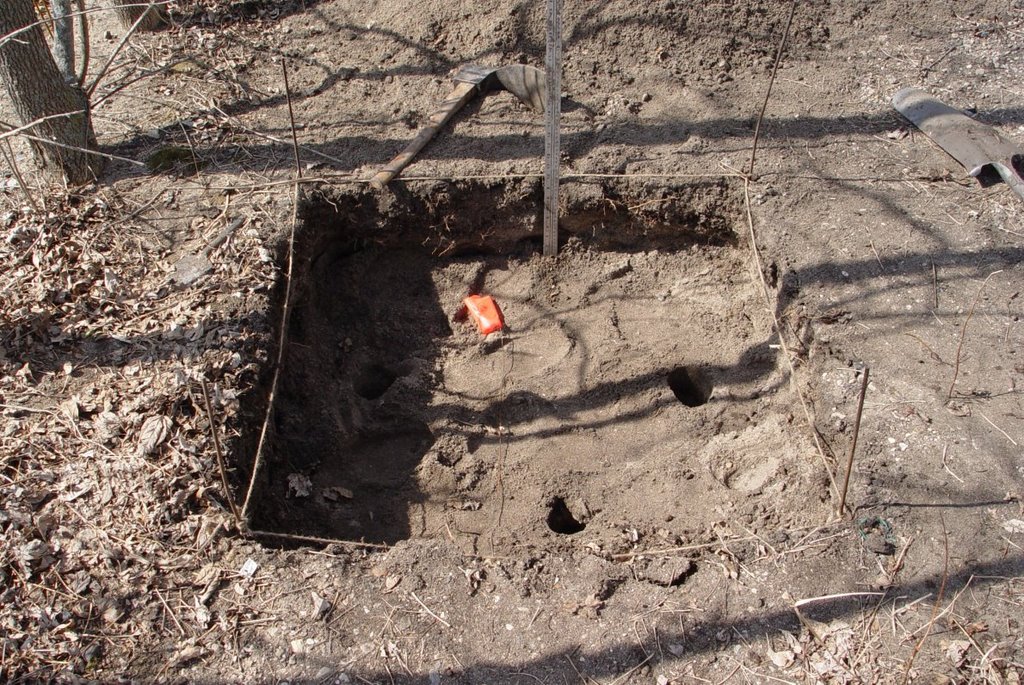
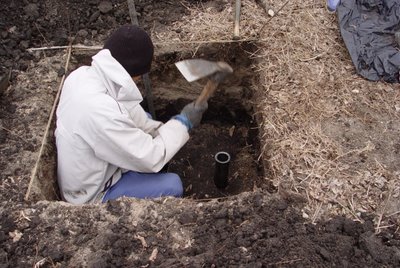

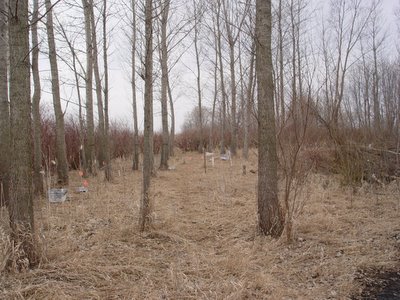
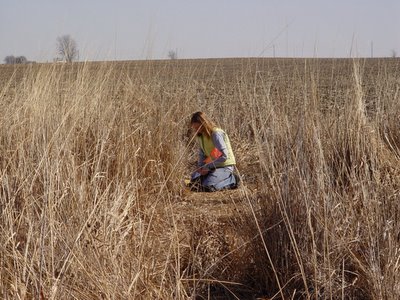
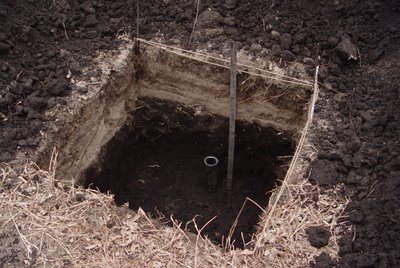 Fig. 8 Collected intact soil cores on the soil surface (80 cm~100 cm).